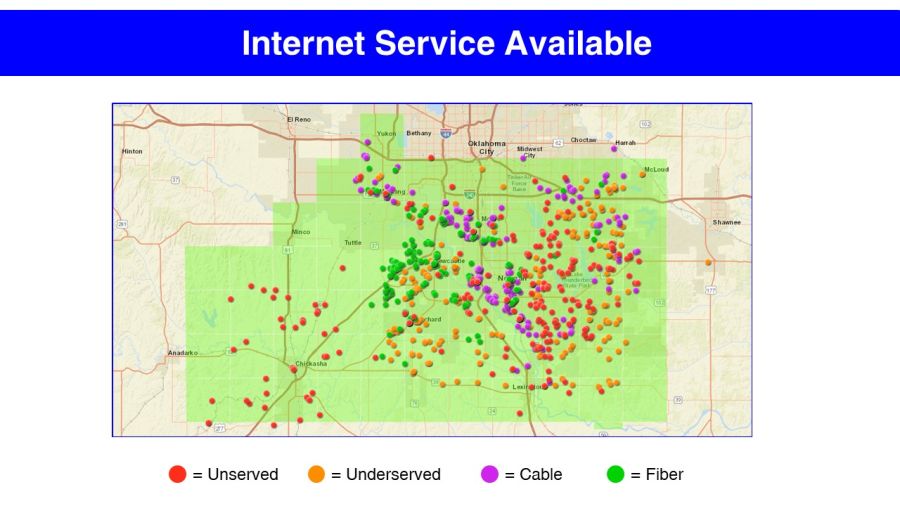
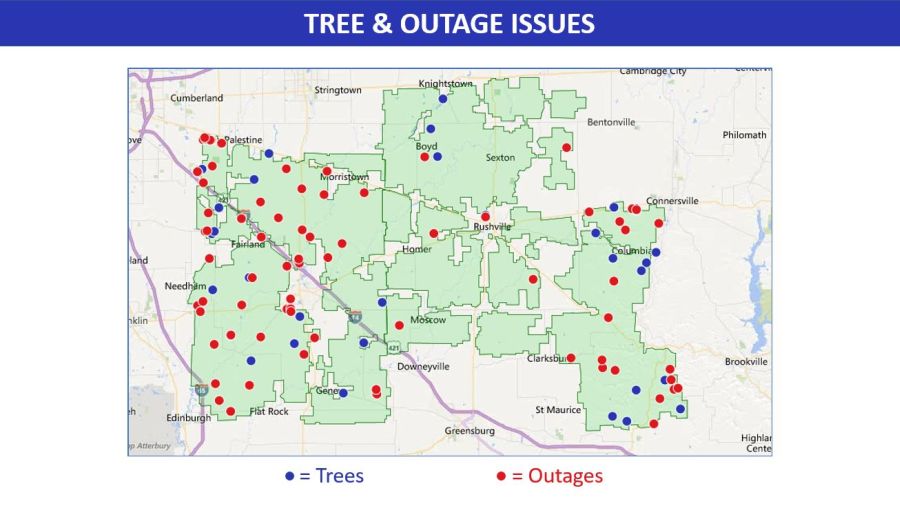
Visualization is key in making data-driven decisions.
Using geocoded boundary data, Inside can create maps utilizing any combination of data points from CIS systems, survey, program participation or other data.
Clients have identified service issues by utilizing mapping to trend customer complaints gathered on surveys. Market feasibility can be evaluated on a specific geographic level when considering new programs. Even something as simple as mapping annual meeting attendance can help management accurately assess trends. Seeing data geographically opens a new world of understanding.